Behavioral Analytics Systems
Role: Product Designer / Team Lead
Focus: Behavioral analytics, decision support, data visualization, and dashboard design
Context: Commissioned by NYC Media Lab Combine III + Verizon Connected Futures
Team: 3-4 interdisciplinary designers and technologists
Context: Commissioned by NYC Media Lab Combine III + Verizon Connected Futures
Team: 3-4 interdisciplinary designers and technologists

Overview
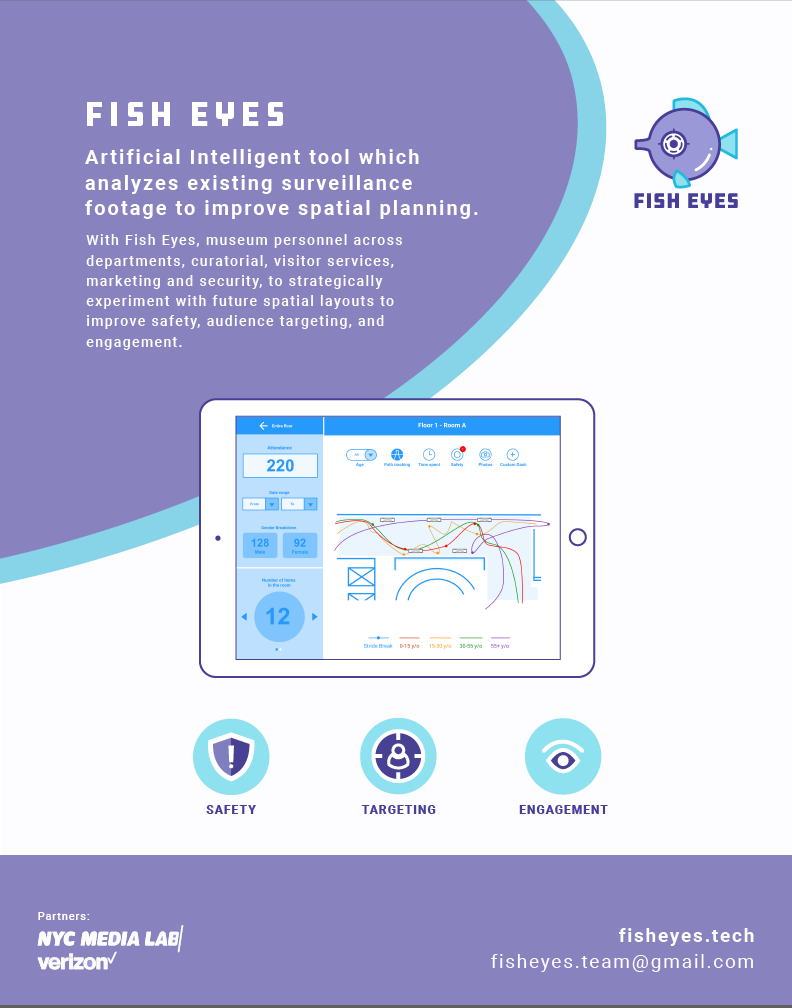
Fish Eyes is a behavioral analytics platform that helps museums understand how visitors move through and engage with physical spaces.
Through research with cultural institutions across North America, we identified a gap in how spatial decisions are informed, especially given the lack of scalable tools for interpreting visitor behavior.
This project explores how existing surveillance footage can be transformed into actionable spatial insights, surfacing patterns in flow, engagement, and visitor experience, without requiring additional tracking infrastructure.
My Role & Contributions
I served as UX Designer and Team Lead for Fish Eyes, overseeing a 3–4 person interdisciplinary team across design and technology disciplines. The project was developed through NYC Media Lab Combine III and Verizon Connected Futures.
As team lead, I was responsible for defining the UX direction, coordinating cross-functional collaboration, and maintaining alignment across concurrent deadlines spanning thesis work, external programs, and stakeholder engagements.
My primary contributions included:
• Leading user research and stakeholder interviews across museums nationwide
• Translating research insights into product requirements and UX direction
• Designing interaction flows and shaping the dashboard experience
• Coordinating iterative prototyping and testing across multiple phases
• Communicating design decisions and findings to program stakeholders and partners
I also contributed to storytelling, system framing, and the translation of complex behavioral data into accessible, decision-support-focused UX patterns.
Problem
Limited Understanding of Visitor Behavior
Museums rely on visitor insights to guide spatial planning, accessibility, staffing, and engagement decisions. However, most institutions lack reliable tools to understand how visitors actually move through exhibitions.
Declining Engagement Pressure
As attendance and engagement decline across cultural institutions, the absence of actionable behavioral data makes it harder to identify friction points, improve experience design, and plan future layouts with confidence.
Design Question
"How might we leverage existing behavioral data to support cross-department decision-making in museums and improving spatial planning, accessibility, and visitor experience?"
Research & Validation
To evaluate whether museums needed a behavioral analytics platform, we conducted 100+ interviews, usability tests, and stakeholder conversations across museums, retailers, and sports venues in North America.
We engaged curatorial, visitor experience, security, facilities, and leadership teams to understand how spatial decisions are made and how visitor behavior is currently captured, interpreted, and applied.
Across all conversations, we examined existing workflows and assessed the potential of repurposing surveillance footage as a source of behavioral insight.

Scope Definition (Museums vs Galleries)
We excluded art galleries from the core focus due to fundamentally different success models:
• galleries prioritize sales-driven engagement
• museums prioritize education, attendance, and visitor experience
This distinction clarified the need to design specifically for institutional, non-commercial spatial goals.
Key Findings
Fragmented Data Collection
Visitor insights were gathered through manual observation and informal reporting, often varying by department. This created inconsistent and sometimes conflicting interpretations of the same visitor behavior.
Visitor insights were gathered through manual observation and informal reporting, often varying by department. This created inconsistent and sometimes conflicting interpretations of the same visitor behavior.
Untapped Behavioral Data
Most institutions already store extensive surveillance footage, but lack tools to convert it into usable spatial insights.
Most institutions already store extensive surveillance footage, but lack tools to convert it into usable spatial insights.
“This is one thing that I’ll tell you that is untapped… The only staff that use the cameras regularly are the security and facilities. We’re capturing all this data every day and people do not use it.”
- Peter Atkinson, Director of Facilities Planning and Management, Harvard Museum of Art
Visitor Friction as a Systemic Issue
Congestion, unclear circulation paths, and navigation challenges repeatedly surfaced as major drivers of reduced engagement and cognitive overload.
Congestion, unclear circulation paths, and navigation challenges repeatedly surfaced as major drivers of reduced engagement and cognitive overload.
“If visitors are inflicted by too much friction from the museum… overwhelming their cognitive load, they will no longer be able to absorb and retain the history and message the museum intends to convey.”
- Sarah Lumbard, Director of Museum Experience and Digital Media, United States Holocaust Memorial Museum
Unclear Adoption Value
Teams expressed uncertainty around how behavioral analytics would translate into real operational decisions, especially across different departments.
Multi-Stakeholder Interpretation of Data
The same behavioral data was interpreted differently across roles—reinforcing the need for role-specific perspectives within a shared system.
Prototype Iteration & Testing
We iteratively developed and tested the Fish Eyes dashboard through in-person and remote usability sessions with museum professionals.
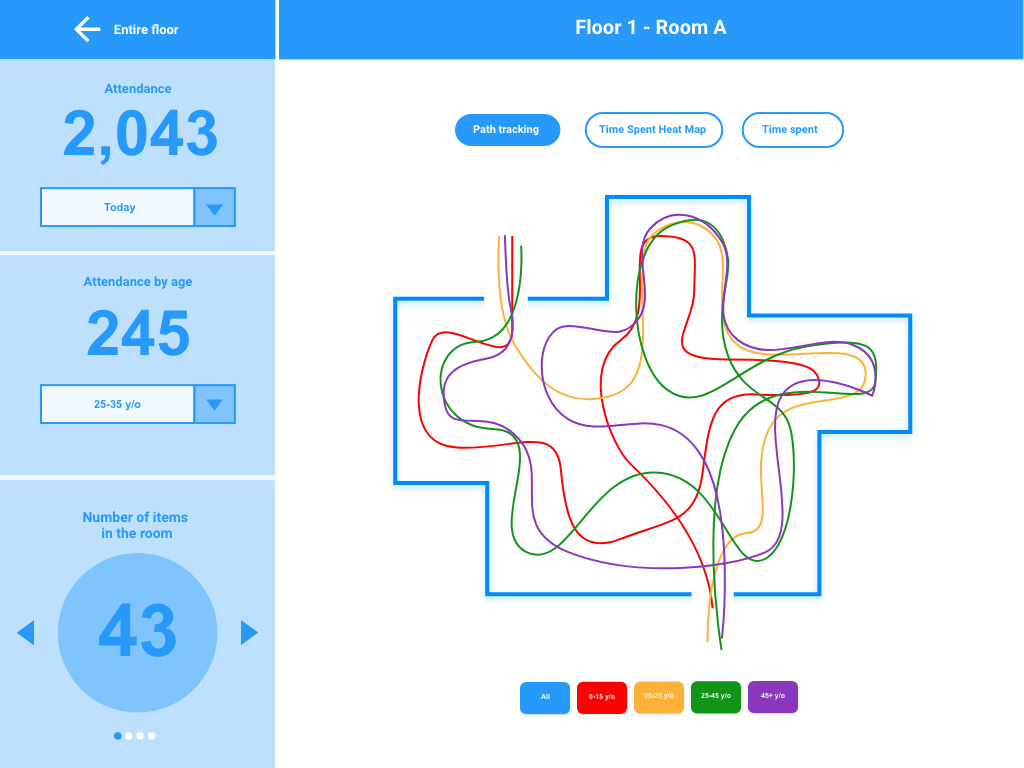
Early prototypes explored how users interpreted behavioral overlays, including:
• Path tracking
• Dwell time
• Engagement zones
• Circulation patterns
During testing, we used think-aloud protocols and scenario-based tasks with curatorial, visitor experience, security, and facilities teams. Each iteration was shaped by direct feedback and field observations, including studies conducted at the Rubin Museum of Art.
Usability Findings
Legend Misinterpretation & Interaction Confusion
Users frequently read legends as interactive controls, creating confusion around how to navigate the interface.
Users frequently read legends as interactive controls, creating confusion around how to navigate the interface.
Visual Encoding Complexity
Overlapping data layers made it difficult to interpret spatial behavior clearly or translate it into planning decisions.
Overlapping data layers made it difficult to interpret spatial behavior clearly or translate it into planning decisions.
Need for Spatial Grounding
Users consistently needed grounding in recognizable physical references to interpret behavioral data effectively.
Users consistently needed grounding in recognizable physical references to interpret behavioral data effectively.
System-Level Insights
Role-Based Interpretation Needs
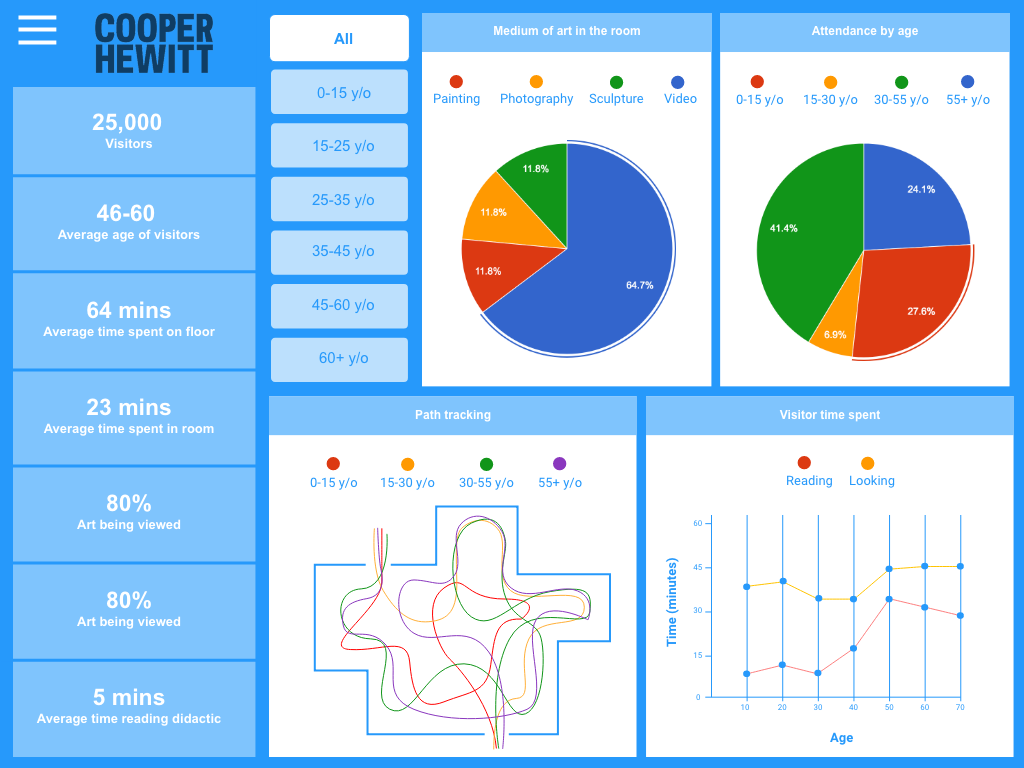
Different museum roles required different interpretations of the same data. Curators, security, and visitor services each prioritized distinct signals, reinforcing the need for role-specific views within a unified system.
Different museum roles required different interpretations of the same data. Curators, security, and visitor services each prioritized distinct signals, reinforcing the need for role-specific views within a unified system.

Adoption Pathways
Operational teams (especially security and facilities) emerged as natural entry points due to immediate needs around safety, compliance, and spatial monitoring.
Trust & Surveillance Perception
Participants raised concerns about perceived surveillance (even with anonymized data) highlighting the importance of transparency in system design.
Participants raised concerns about perceived surveillance (even with anonymized data) highlighting the importance of transparency in system design.
Modular Dashboard Architecture
These insights led to a modular dashboard approach, allowing departments to customize how they interact with shared behavioral data while maintaining a consistent underlying system.
These insights led to a modular dashboard approach, allowing departments to customize how they interact with shared behavioral data while maintaining a consistent underlying system.
Market & Competitive Landscape
Ecosystem Positioning
Fish Eyes sits at the intersection of retail analytics, security systems, and behavioral research tools, translating spatial movement into interpretable insights for cultural institutions.
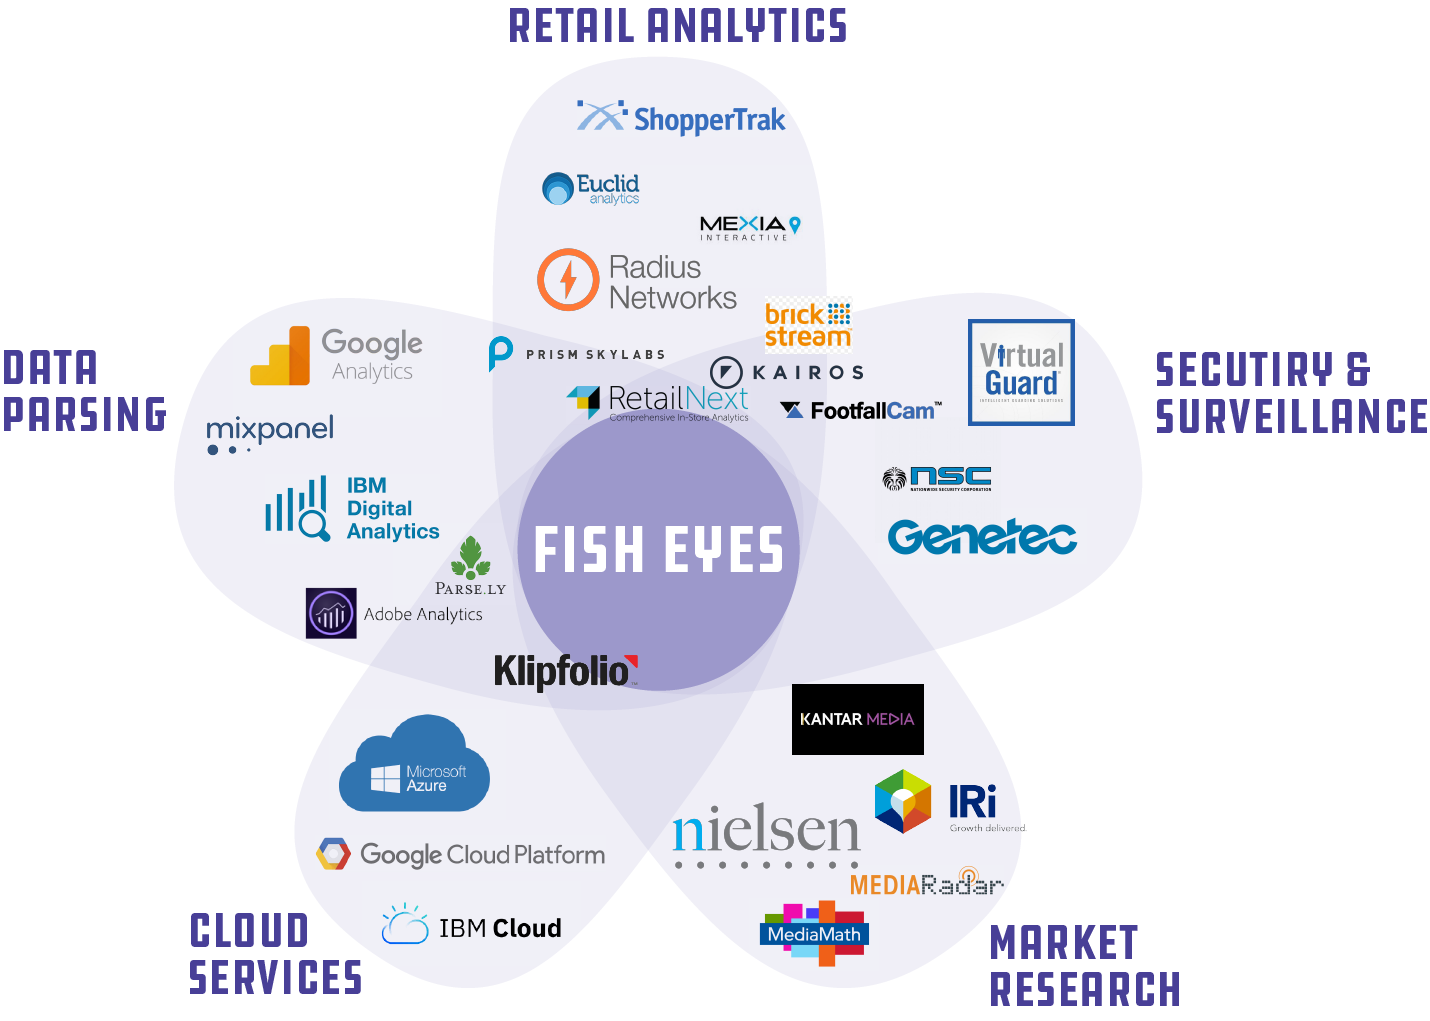
This positions Fish Eyes as an interpretation layer between surveillance infrastructure and spatial decision-making, with a focus on clarity for non-technical stakeholders.
Competitive Analysis
We analyzed tools across retail, venue, and surveillance-adjacent systems to understand how behavioral data is captured and used.
Retail Analytics (RetailNext)
• Heatmap-based movement tracking
• Entry/exit traffic counting
• Demographic segmentation
Venue & Crowd Analytics (FanCam)
• Large-scale crowd imaging and engagement tracking
• Event-based behavioral analysis
• Post-event audience insights
Key Insight
Existing systems are optimized for aggregate reporting and commercial outcomes, not spatial understanding within complex environments.
They tend to prioritize:
• summary-level insights
• revenue or security metrics
• post-event analysis
But lack:
• room-level spatial intelligence
• cross-department interpretation
• decision support for layout planning
This gap directly informed FishEyes’ focus on spatial planning intelligence for museums.
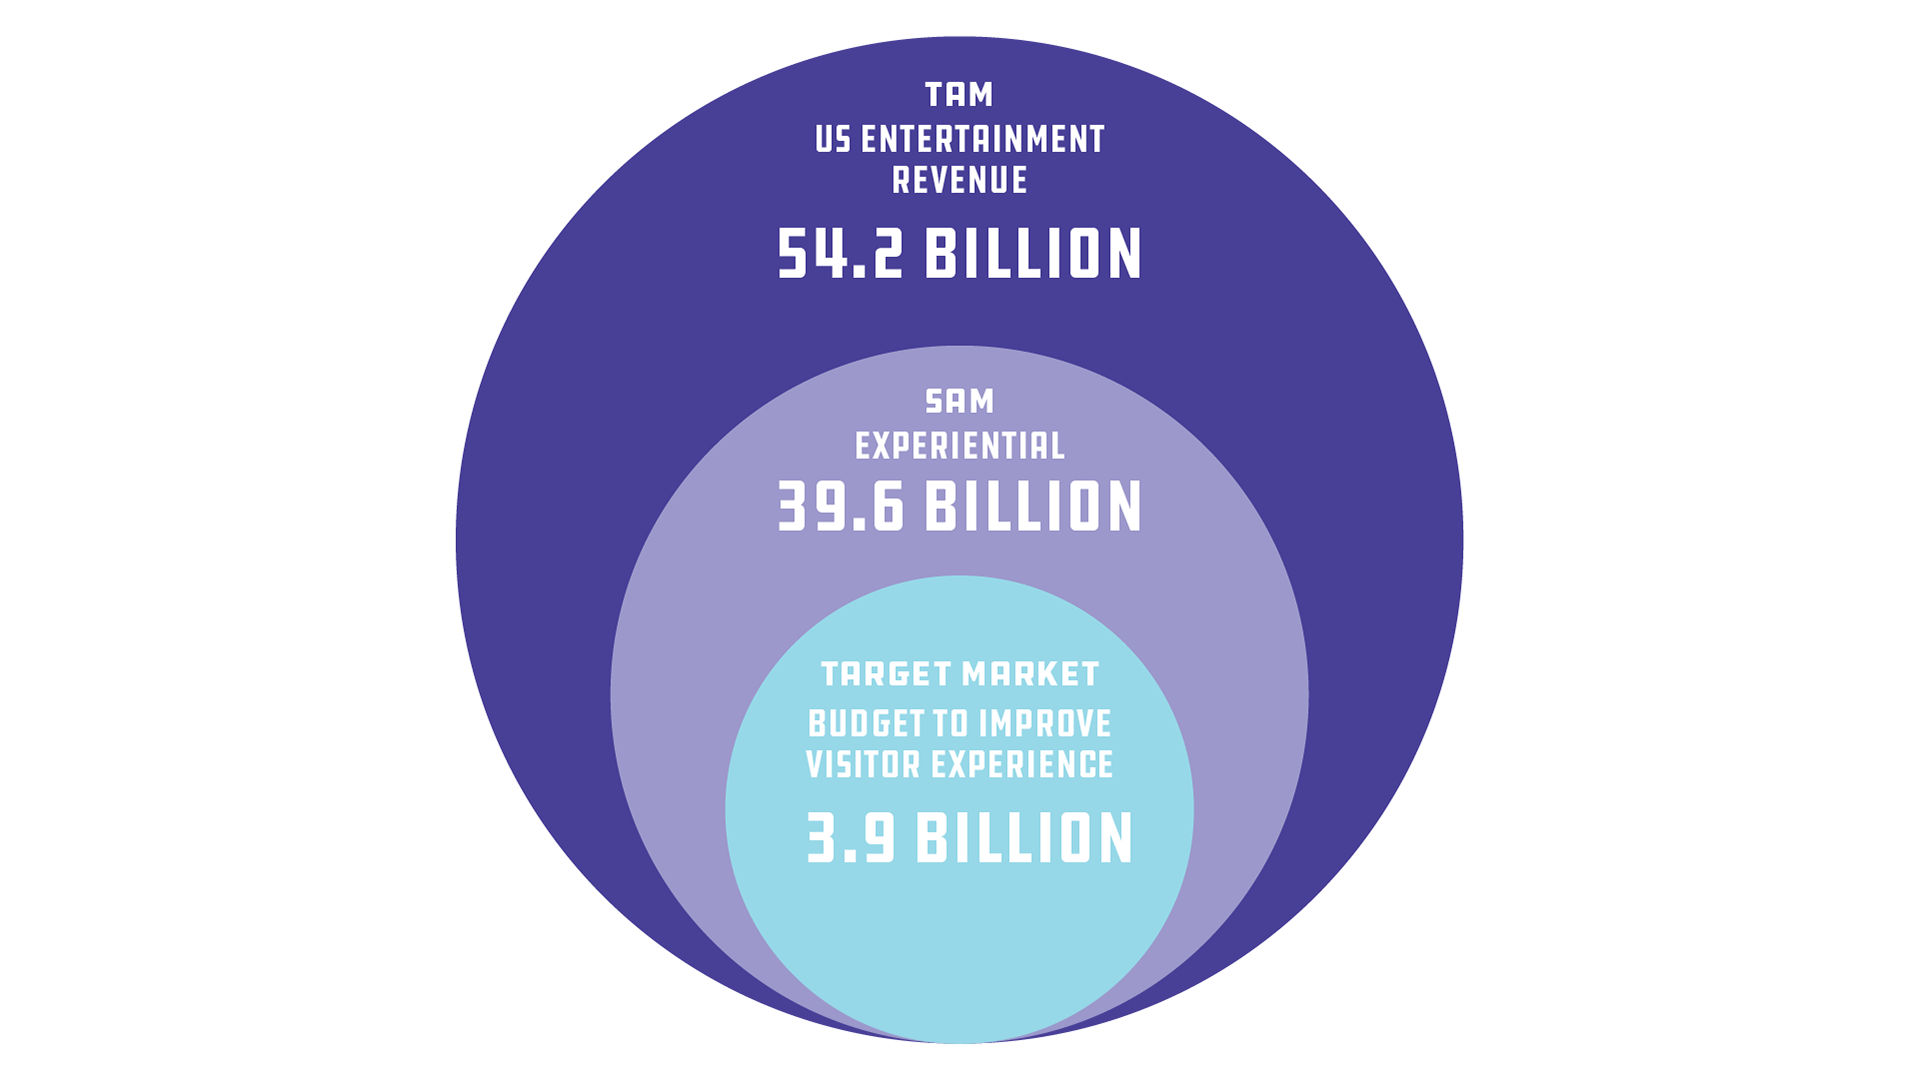
Market Opportunity
FishEyes operates within the experiential analytics space, covering museums, cultural institutions, live events, and public venues where spatial behavior directly impacts engagement.
While the broader market includes many location-based experiences, FishEyes focuses on institutions actively investing in improving visitor experience, accessibility, and spatial efficiency through data-informed planning.
Design Considerations & Tradeoffs
These tradeoffs shaped Fish Eyes’ UX direction, ensuring the system remained interpretable, ethical, and usable in real institutional contexts.
Privacy vs Insight
Prioritized anonymized behavioral patterns over individual tracking to reduce surveillance concerns in cultural environments.
Accuracy vs Interpretability
Simplified AI outputs into readable spatial trends, favoring clarity over technical model precision.
Flexibility vs Cognitive Load
Reduced early customization to prevent overwhelming non-technical users working with complex datasets.